Example Power BI dashboard: flow dashboard
Description on how to create a Flow dashboard in Power BI and publish it on the Sensolus platform
The flows feature does not have a dedicated dashboard in the platform. Therefore it can be useful to create one yourself when you want to manage flows. You can use Power BI to make such a report. The procedure contains following steps:
- Configure flows
- Schedule an automatic flows report
- Import the latest flows report via API in Power BI
- Import Asset information via API in Power BI
- Create Power BI dashboard
- Publish dashboard on Sensolus platform
Configure flows
Go to ![]() Admin → Insights → Flows to start configuring your flows.
Admin → Insights → Flows to start configuring your flows.
Shedule an automatic flows report
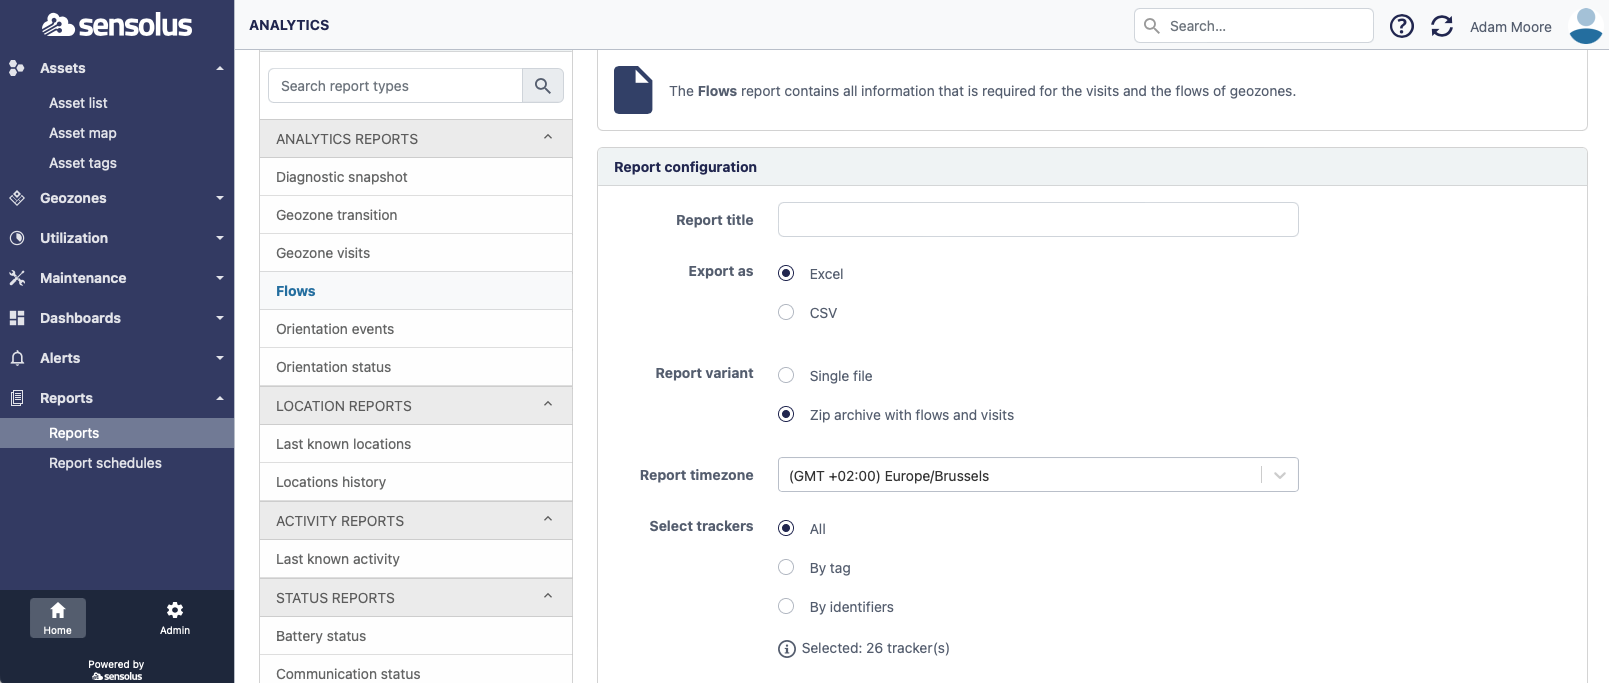
Schedule a report of the type flows.
Set the following parameters and save the report:
- Report title: relevant title, for example Flows_weekly
- Export as: Excel (CSV is also ok and better suited for long files)
- Report variant: Single file (Power BI cannot handle ZIP files)
- Select trackers: all trackers or a subset
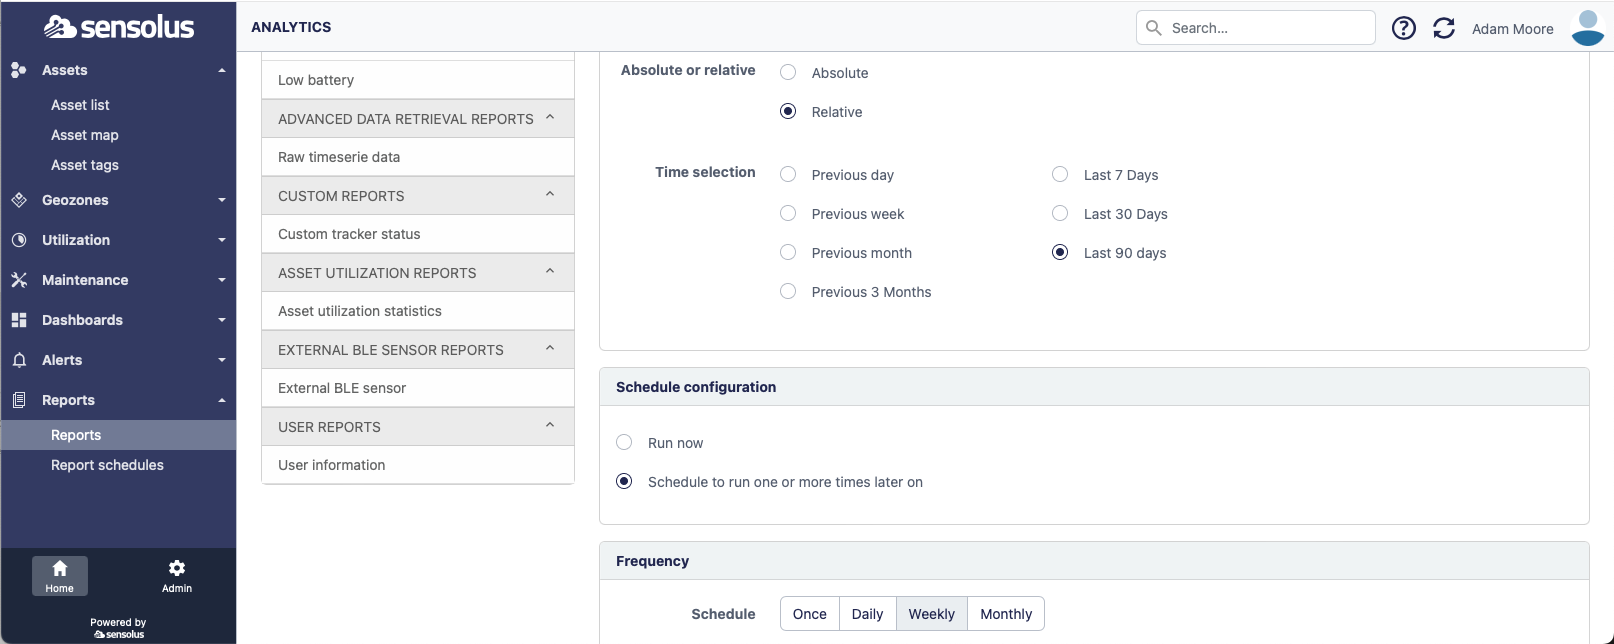
- Absolute or relative: relative so in future it takes new data into account
- Time selection: last 90 days to take data of the longest possible period
- Schedule configuration: Schedule to run one or more times later on (makes sure the report gets created automatically)
- Frequency: how often should the report be refreshed, for example weekly
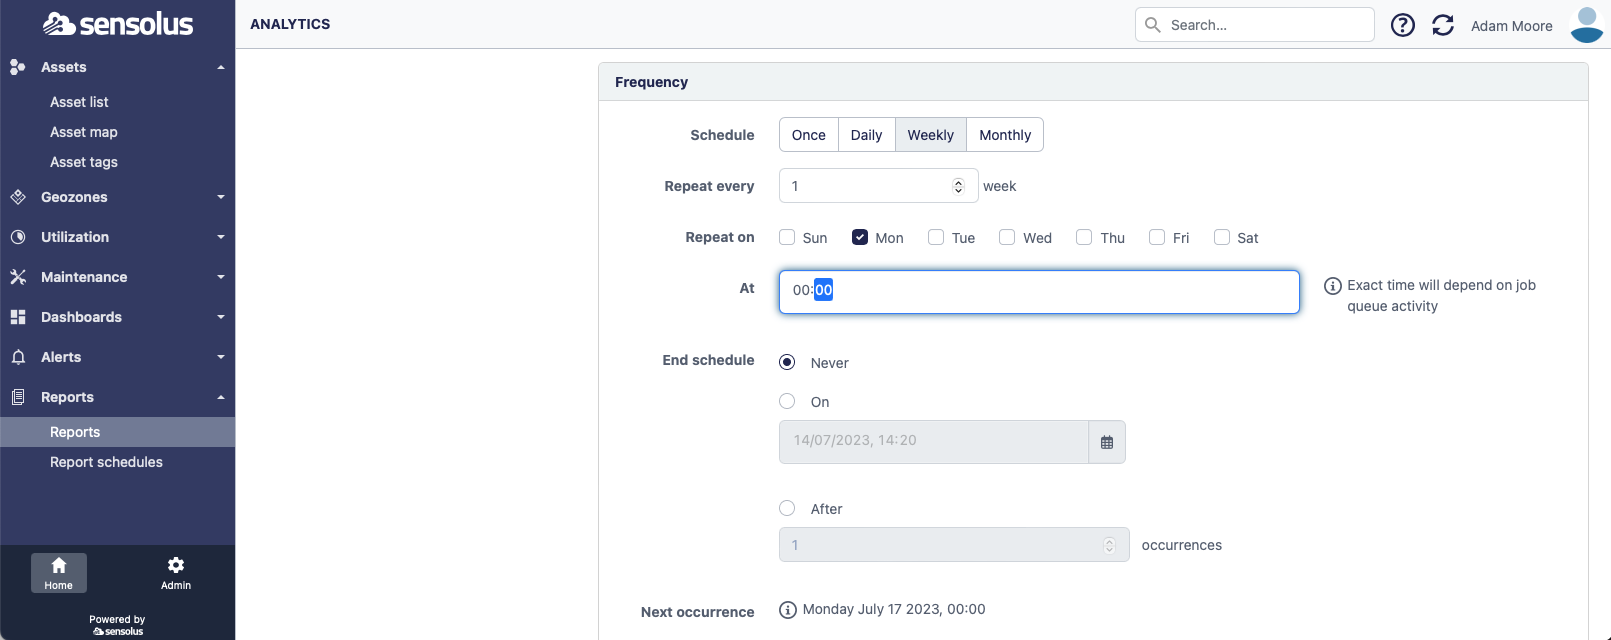
- Repeat every: 1 week to have it every week
- Repeat on: select day of the week the report should be created
- At: midnight (time on which the report should run)
You can find out the report ID by going to Reports →
Report schedules and click the ![]() view icon righthand side of the report you just created:
view icon righthand side of the report you just created:
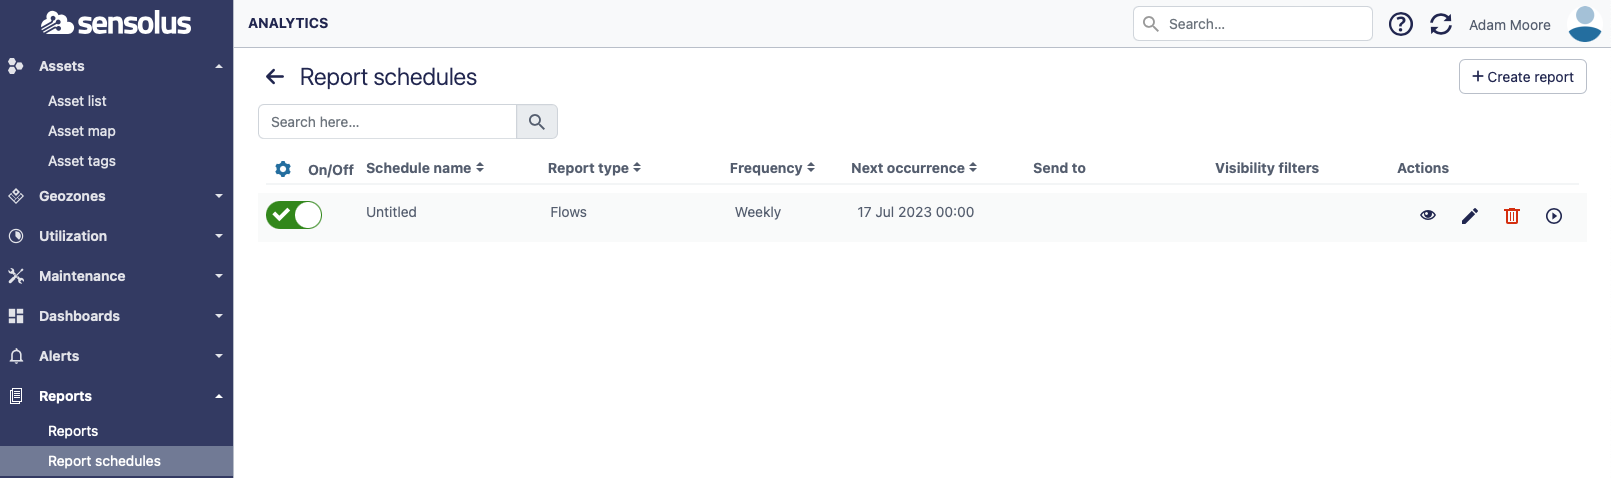

In the example the report ID is 118.
Also click the button Run now to already have a report.
Import the latest flows report via API in Power BI
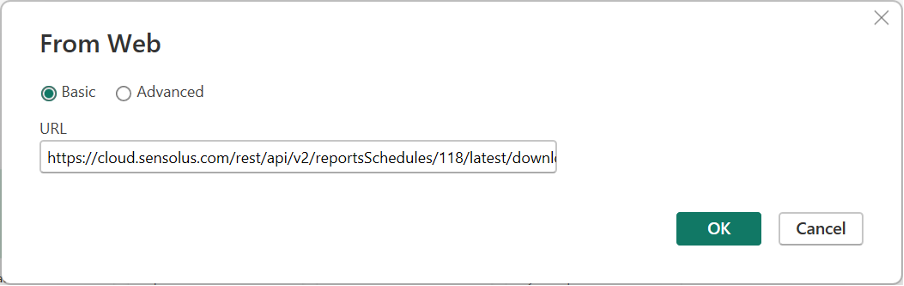
Open Power BI desktop and import the report via Get data → web and pasting the following URL:
https://cloud.sensolus.com/rest/api/v2/reportsSchedules/118/latest/download?apiKey=XXX
Where you replace 118 by your report’s ID and fill in your API key instead of XXX.
If an additional window pops up, click connect button. Normally
you end up in the Power query editor. Right click the cloud.sensolus.com object and select
Excel Workbook: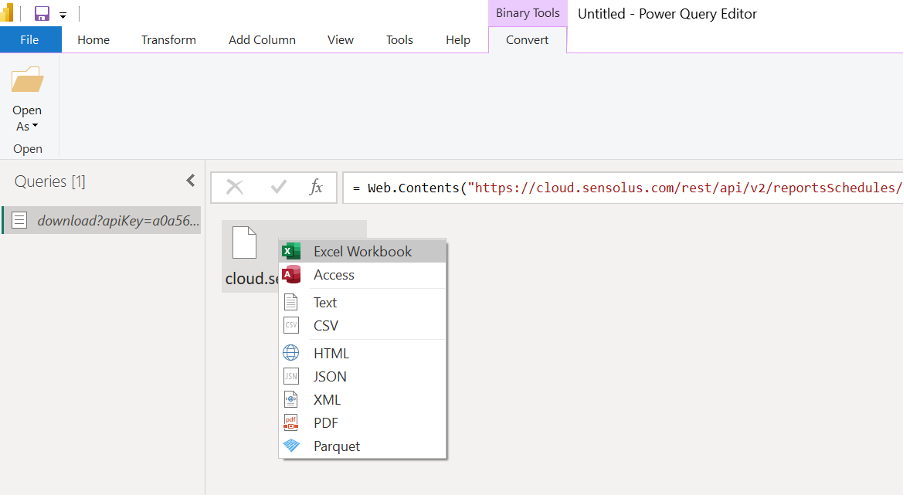
You will see two lines, one for the report info and one for
the report data. In the second line, right click table and select add as new query: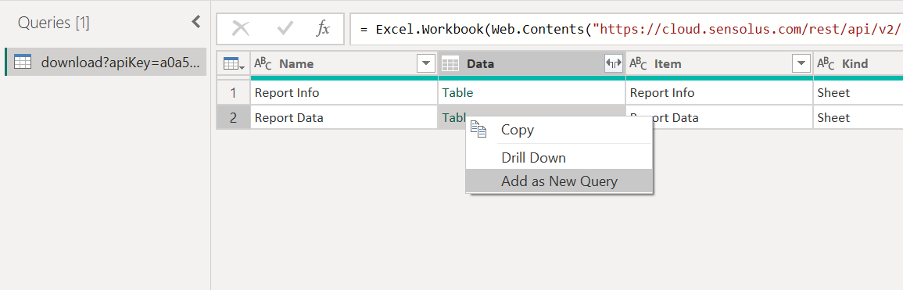
The data is now added as a report: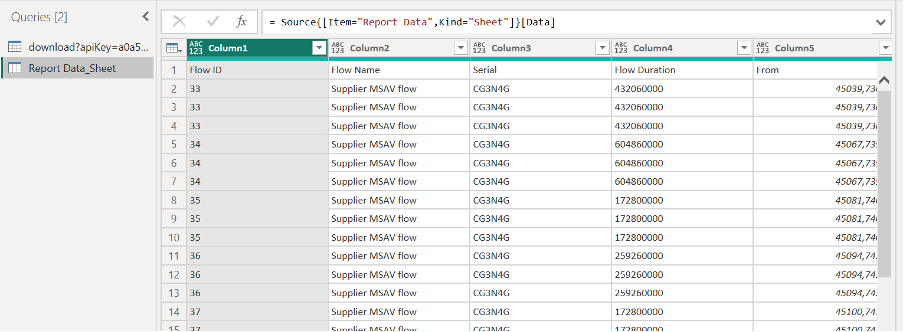
You can give it a meaningful name by right clicking Report
Data_Sheet in the left column and select rename: 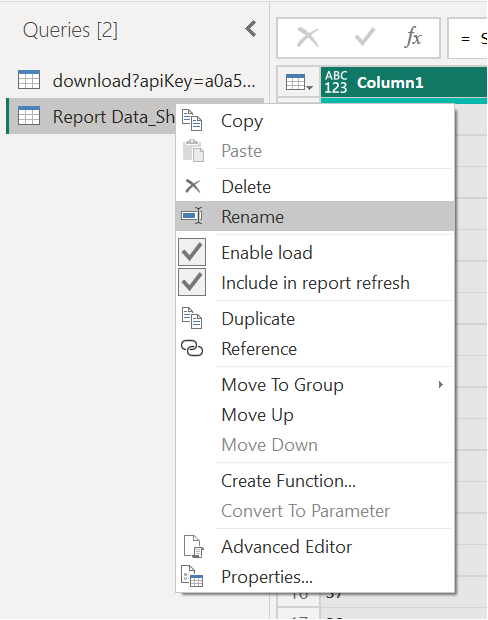
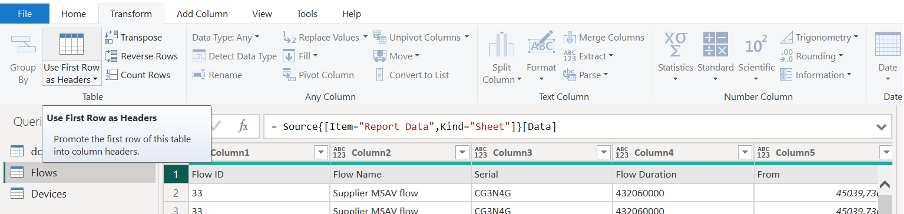
Use the first row as column header, select transform → Use First Row as Headers:
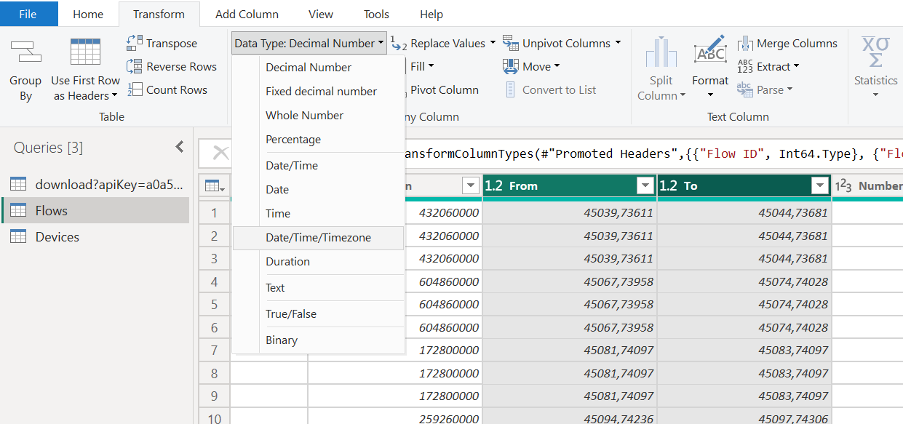
You might notice the from and to column do not have correct datatype, they should be date time instead of decimal. You can adapt this by selecting both columns and go to Transform → Data Type and select: Date/Time/Timezone. In the window that pops up: click Replace current button.
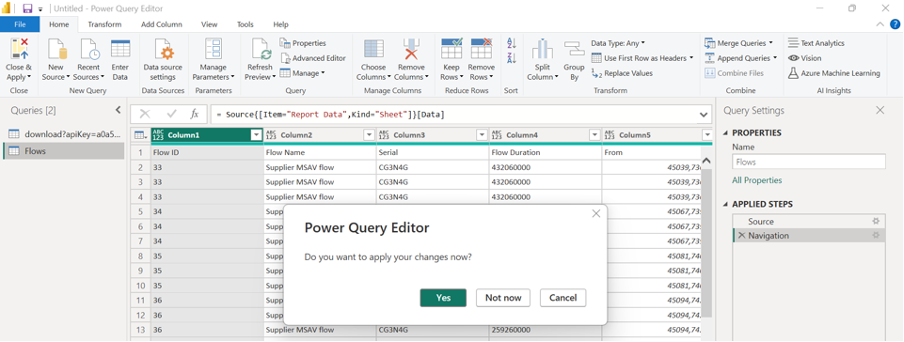
Close the Power Query Editor by clicking the x icon and select Yes to apply changes:
Import Asset information via API in Power BI
Open Power BI desktop import data via Get data → web and pasting the following URL:
https://cloud.sensolus.com/rest/api/v2/devices?apiKey=XXX
where you replace XXX by your own API key
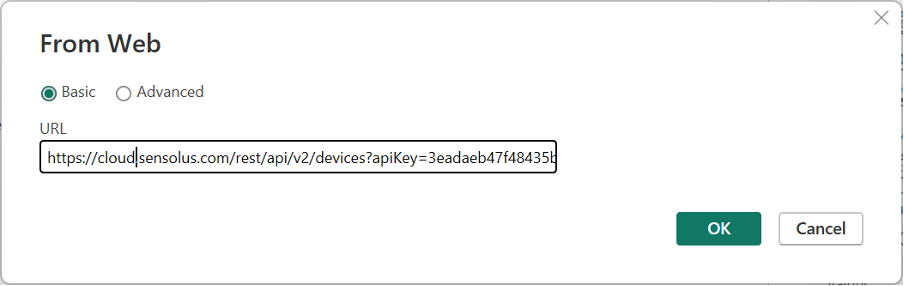
Click OK. The power query editor will open. The data is loaded. You can rename it and close the window. Click yes to apply changes.
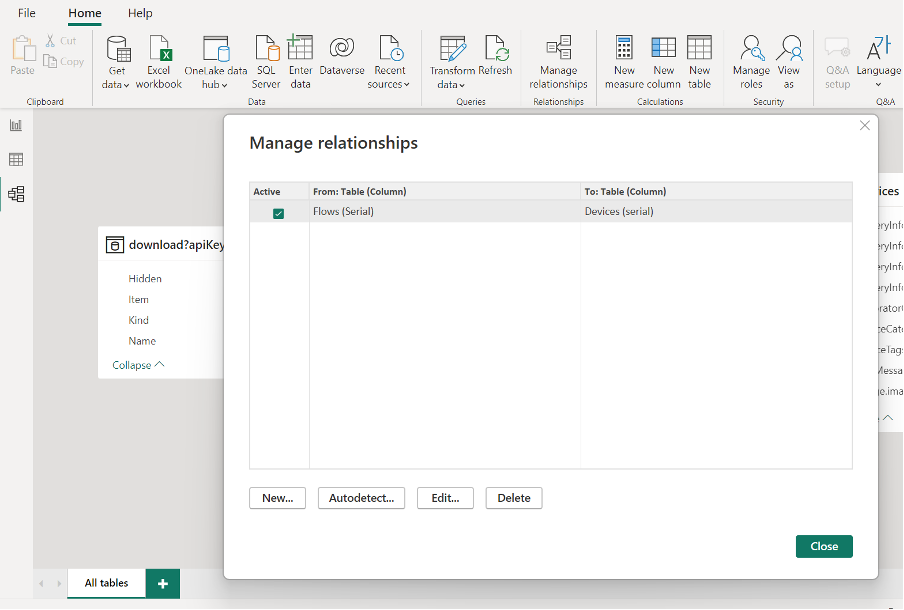
You end up with two datasets: the flows and the devices info. Because you might want to use filtering based on device tags you should link both datasets. You can do this by going to: Model view (left menu) → Manage relationships. There you link the Flows serial to devices serial:
Create Power BI dashboard
Follow the procedure to create a Power BI dashboard as explained in this documentation center of the one of Microsoft
Publish dashboard on Sensolus platform
Follow the publication procedure as described in the documentation center.