Create dashboards
Explanation on how to start creating your own dashboards
If you want to learn what Sensolus dashboards are and how you can start working with them, take a look at the movie below.
If you want to start creating custom dashboards or embedded iFrame or Power BI dashboards go
to ![]() Admin → Insights → Dashboards.
Admin → Insights → Dashboards.
Dashboard list
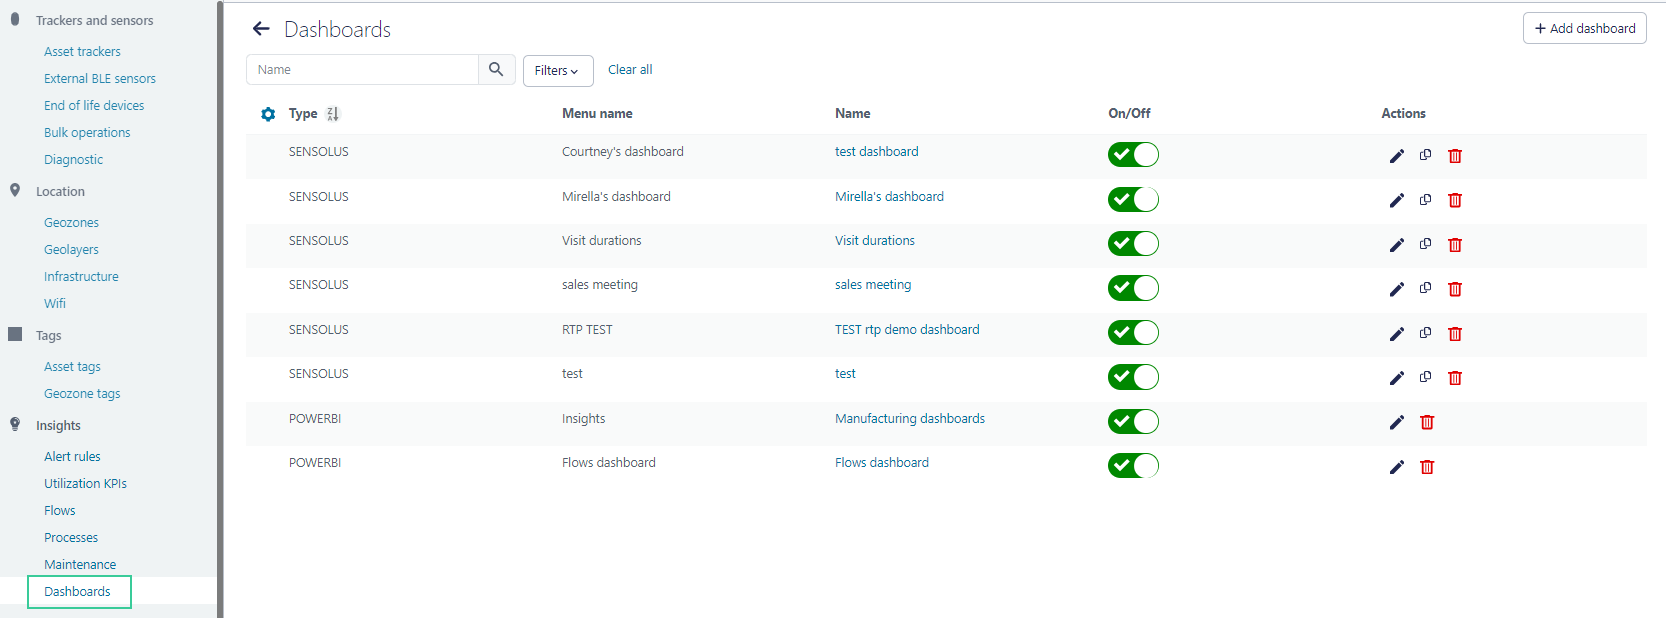
| Description | |
|---|---|
| Type | Type of dashboard: custom, POWERBI, iFRAME |
| Menu Name | Name shown in the left platform menu. Maximum 15 character |
| Name | name of the dashboard as shown on top of the dashboard |
| Activated | Is the dashboard active (visible) or inactive (invisible)? |
| Description | Short description of the dashboard as filled in by the creator of the dashboard |
| Owner | Account that created the dashboard |
| Favorite for all | When a dashboard is favorite it appears on top in the Dashboard menu. When you make the dashboard available to other users it will appear on top in the Dashboard menu of every user you shared the dashboard with. |
| Availability | A dashboard can be available 'only for me' or 'for all users'. You decide this when you create a dashboard. This information is shown here. |
| Actions |
|
Add dashboard
Click the  icon to start creating a new dashboard. The
create dashboard page will appear. The page has some fields that are the same for custo,
embedded IFrame and Power BI dashboard type, and some fields that are different.
icon to start creating a new dashboard. The
create dashboard page will appear. The page has some fields that are the same for custo,
embedded IFrame and Power BI dashboard type, and some fields that are different.
In this section we focus on the general fields. The specif fields for the embedded IFrame and Power BI dashboards are described in the corresponding documentation.
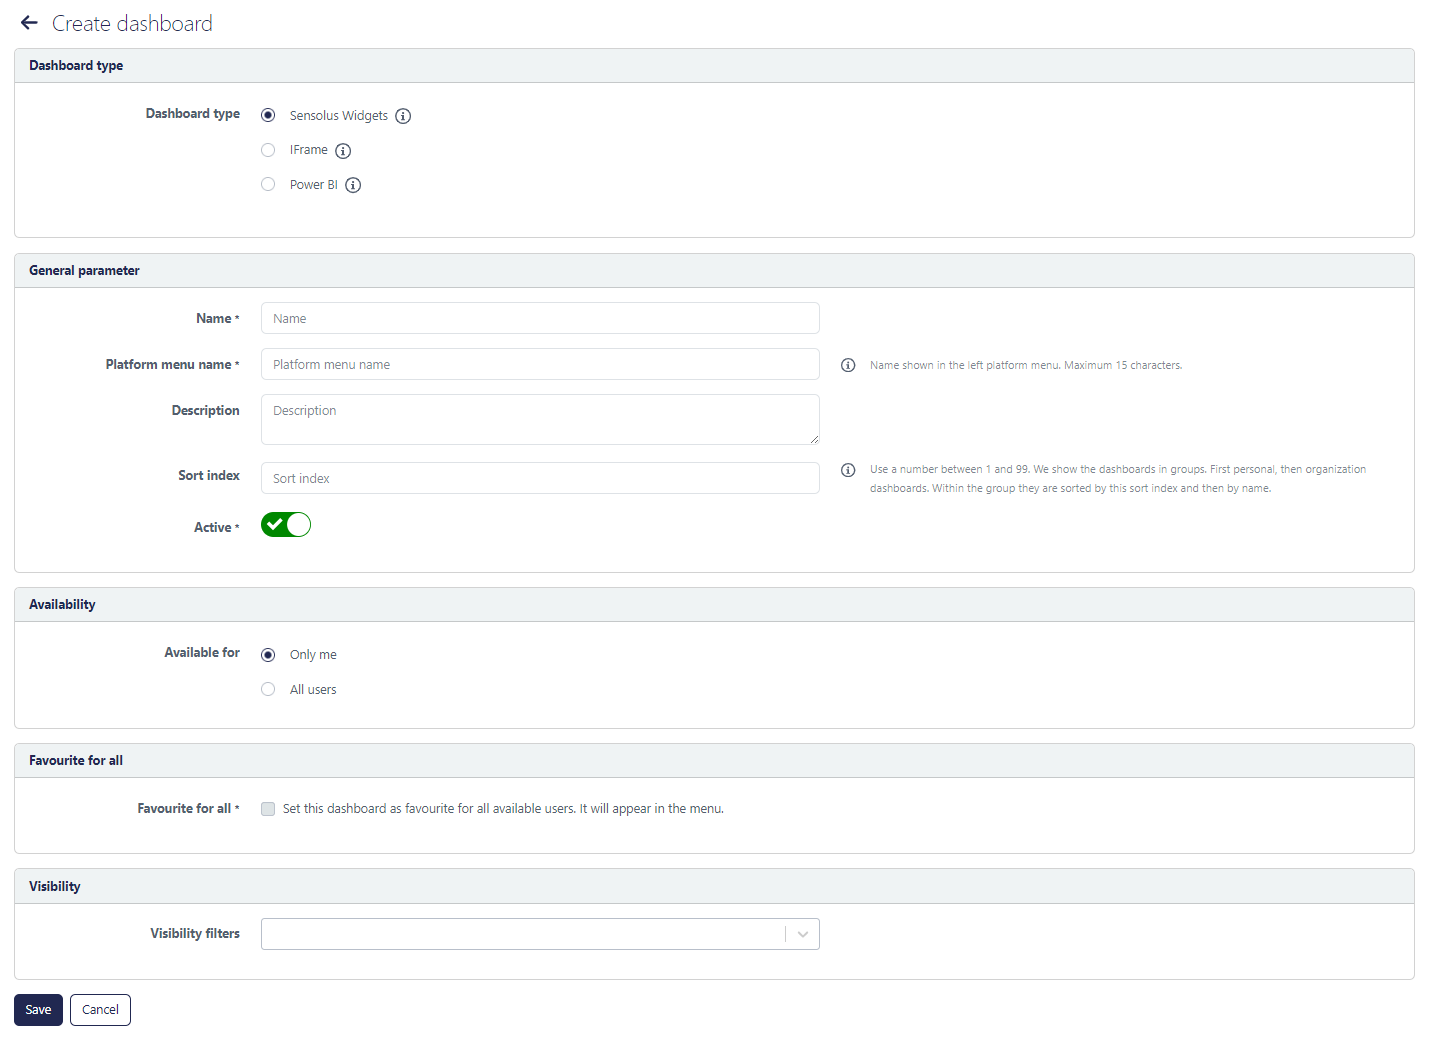
On this page you have to fill in the following fields about the dashboard you start to create:
| Field name | Description |
|---|---|
| Dashboard type | Here you select the type of dashboard you want to create. You can choose between |
| Name | Name of the dashboard that will appear on top of the dashboard |
| Platform menu name | Name as will be shown in the left platform menu. It can contain maximum 15 characters. |
| Description | Text field where you can write a short description of the dashboard (for example: comparison of stock in different fabric halls) |
| Sort index | Ordering of the dashboard in the left menu bar. The ordering is defined as
following from top to bottom:
|
| Activate dashboard | Selector to decide if the dashboard is already shown on the platform or still invisible (for example if you are still creating it) |
| Select Image | Upload an image that is meaningful for your dashboard. This image is shown on the dashboard overview page. |
| Availability | Selector to decide if only your own account, or all users of your organization can see the dashboard |
| Favorite for all | If you make the dashboard available to all users you decide here if you favorite it also for them. To favorite a dashboard means it is put on top in the menu bar. |
| Visibility | Partners only field. Here partners can choose with whom to share the
dashboards. This can be done in 2 ways:
|
Click  to save the created
dashboard
to save the created
dashboard
Edit the dashboard settings
In the dashboard list you select the ![]() edit icon edit the dashboard. Here you can change fields you
filled in when creating the dashboard (name, availability, …).
edit icon edit the dashboard. Here you can change fields you
filled in when creating the dashboard (name, availability, …).
Another way to edit your dashboard settings it to go to the dashboard in the Home menu and
click the  Dashboard settings button. Here you adapt the configuration
and click to save.
Dashboard settings button. Here you adapt the configuration
and click to save.
Duplicate the dashboard
Often the fastest way to start to create a dashboard is to duplicate an exisiting one and
then make some modifications to the widgets. To copy an existing dashboard, click the ![]() copy button in the dashboard list.
After you copied the dashboard, the new one will appear in the dashboard list. Select the
copy button in the dashboard list.
After you copied the dashboard, the new one will appear in the dashboard list. Select the
![]() edit icon to edit
the configuration of the dashboard. Once you did that, start editing the widgets on the
dashboard.
edit icon to edit
the configuration of the dashboard. Once you did that, start editing the widgets on the
dashboard.