Embedded iFrame dashboards
Explanation on embedding iFrame dashboards on the Sensolus platform
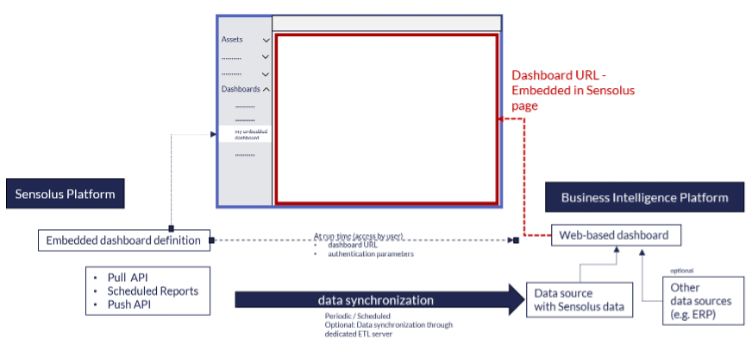
Several business intelligence solutions allow embedding web-based dashboards into another web page. The dashboard itself is created and maintained in the proprietary business intelligence tool. When this dashboard is embedded in the Sensolus platform, it is seamlessly integrated. A regular user can quickly access the dashboard from within the Sensolus platform, without having to switch to a different application.
Embedded dashboards can be used for two primary reasons:
- To visually represent information which is fully present in the Sensolus back-end, but represent or summarize it in a way that is not included in the default Sensolus platform user interface.
- To visually represent Sensolus information combined with other data sources outside of the Sensolus platform. This typically requires a data warehouse and ETL (Extract-Transform-Load) middleware.
The methodology to create an embedded iFrame dashboard is to create it first in your own BI tool, and then upload this dashboard to the Sensolus platform. First you import data in your BI tool. You filter it, link it and create the dataset you need. This dataset will be used to create a dashboard where you visualize the data with graphs, tables, maps,… Once you have the dashboard ready you can upload it on the Sensolus platform, from then on it is always available as an embedded dashboard that can be consulted by users of the platform without the need for them to have the BI tool.