Geolayers
What are geolayers and how to show them on your maps. How to show Sigfox or NB-IoT coverage maps on the maps on the platform
A geolayer is a graphical overlay for a map that is used to provide additional information. Examples of geolayers are floor plans, railways,…
Switch geolayers on or of on a map
All maps are by default (base layer) shown with a streetview. If you prefer the satellite view on your maps, you can change this as following: Go to a map → click on the layer button that you find in the lower left corner of the map.

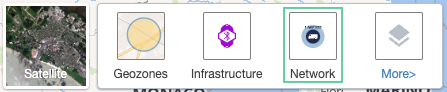
Here you can select which of the default geolayers you want to visualize:
- Show or hide geozone(s)
- Show or hide infrastructure
- Show or hide network locations
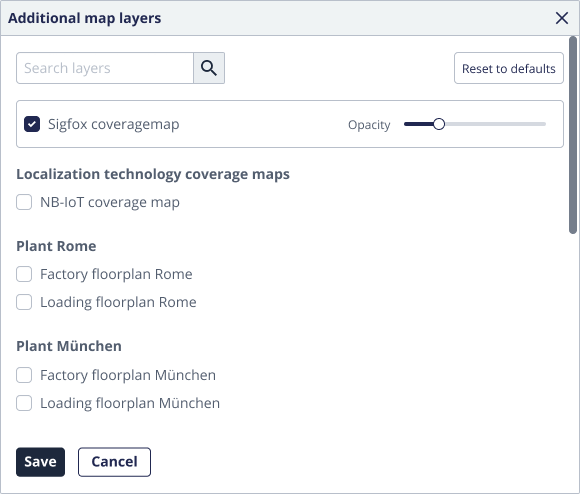
The coverage maps of the communication network are also provided as geolayer. Following types of coverage maps are shown:
- Roaming agreement coverage maps of Nb-IoT communication network provider(s): this
map is interesting if you use trackers communicating over the Nb-IoT network (TRACK 11xx).
To know if your trackers will be able to send their location to the Sensolus platform it
should travel within an area with network coverage. The Nb-IoT network providers hand over
a coverage map to Sensolus which we show as a geolayer. Note: Nb-IoT coverage is not stable yet. It is not world-wide but is still growing over time, so this map will change over time. Network providers are also always optimistic when showing the covered areas, therefore it is not a 100% guarantee when a network provider shows the area as covered. What you can be sure about is that if they show it as non-covered area, it will for sure not be covered (at that moment in time).Note: Vodafone also provides its own Network status checker site.
- Live coverage maps: this map is generated by Sensolus itself. By analyzing the
data of the trackers we create our own coverage map. From the moment a tracker sends one
location point in live mode (not in resend mode guaranteed by our data integrity
algorithm) we define the area as covered (shown in green). As long as the data of the
trackers arrives later then 30 minutes after being send (= not live) we show the area in
red (not covered). Note: Live coverage maps are updated every 24 hours.
- Sigfox coverage map: this is the coverage maps of the communication technology provider Sigfox. This map is interesting if you use trackers communicating over the Sigfox network (TRACK 10xx).
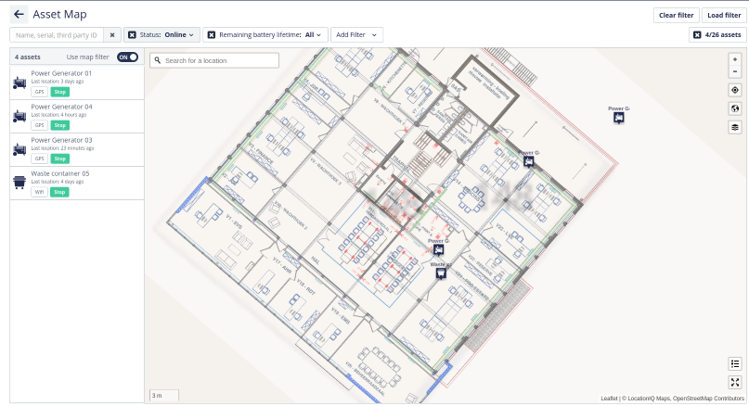
Image based geolayers
This type of geolayers allows to show an image in overlay on a map. They are typically used for showing additional static information, such as floor plans, on the asset map.
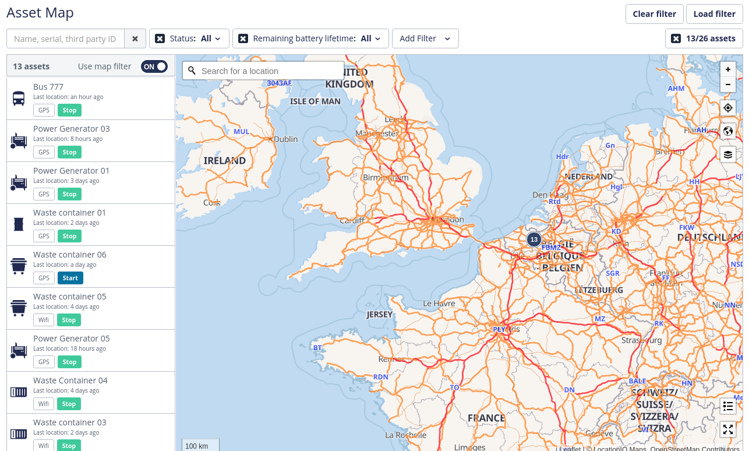
Tile based geolayers
Tile based geolayers are typically used for adding dynamic information, such as railways, to the asset map (Wikipedia: tile based overlays).
Managing geolayers
Geolayers can be managed by navigating to ![]() .
.
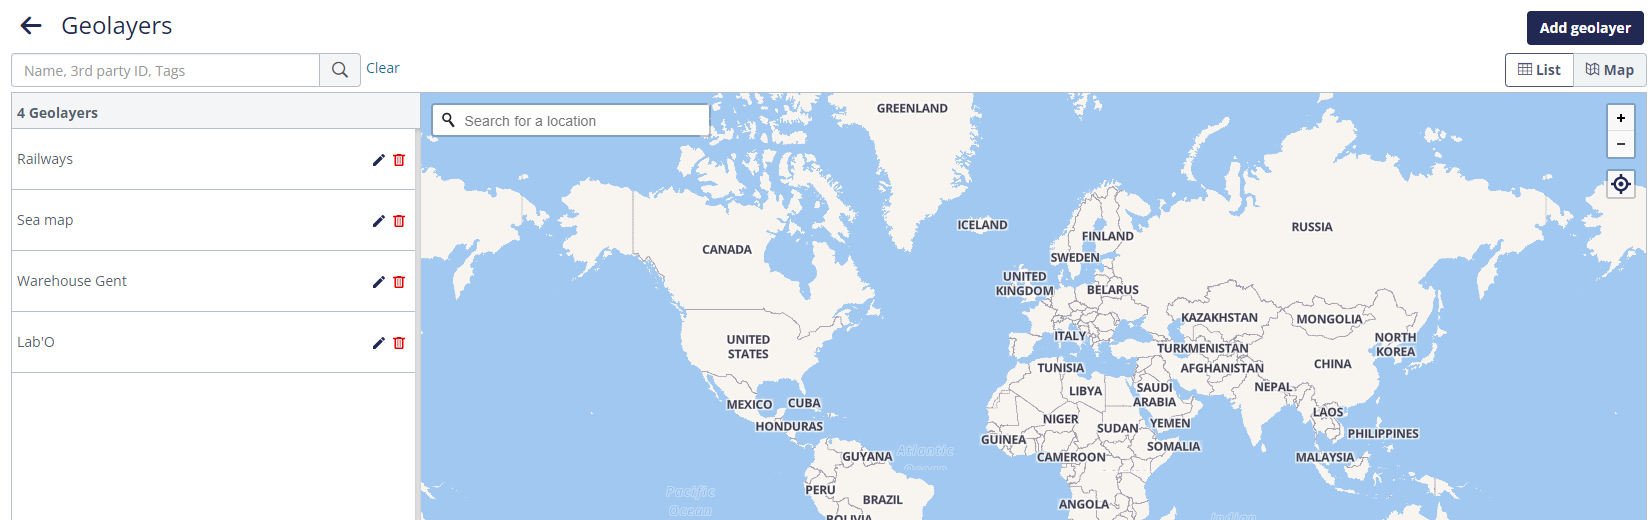
The geolayer admin entry page has 2 different views that can be toggled by clicking on the
view  switch button.
The map view shows all created geolayers on the map on the right while the summary
of all visible geolayers is listed on the left. Next to each geolayer in the list you find
actions to ![]() edit or
edit or ![]() delete the geolayer.
delete the geolayer.
The list view shows all created geolayers in a list. The columns specify additional
info like the type of the geolayer. In the action column you can edit ![]() or delete
or delete ![]() the geolayer.
the geolayer.
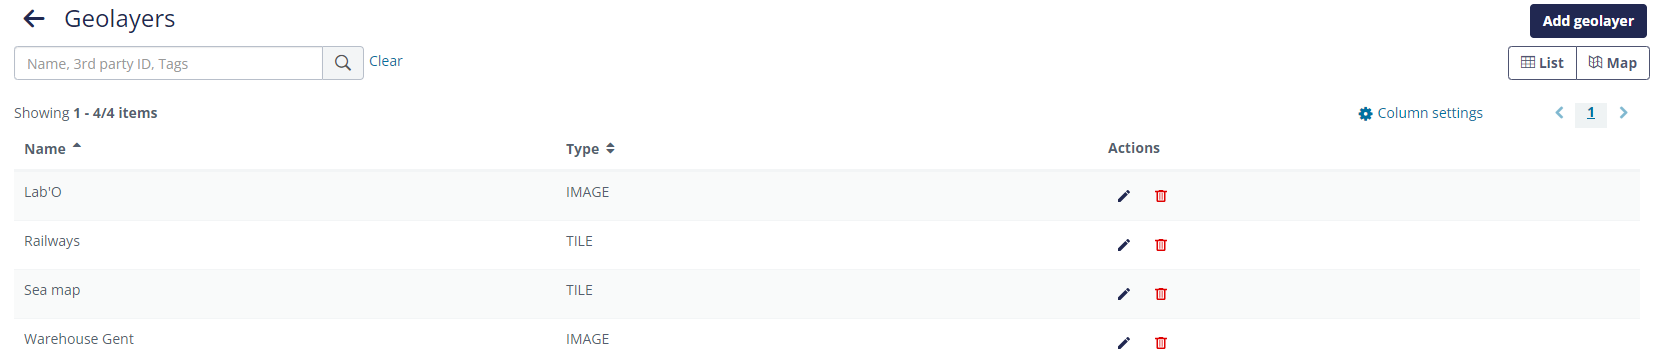
On the top right of both views you find the  button to add a geolayer.