Asset Details: Journeys
See the trip or journey of your assets while they are traveling.
The journey of an asset is the visualization of all the locations and movements of the asset, including the date and time of arrival or departure, and the time spent traveling (on the move; the relocation of the asset). Note that the temporal and geographical accuracy of the journey are influenced by the tracker configuration (frequency of location updates and location technology used).
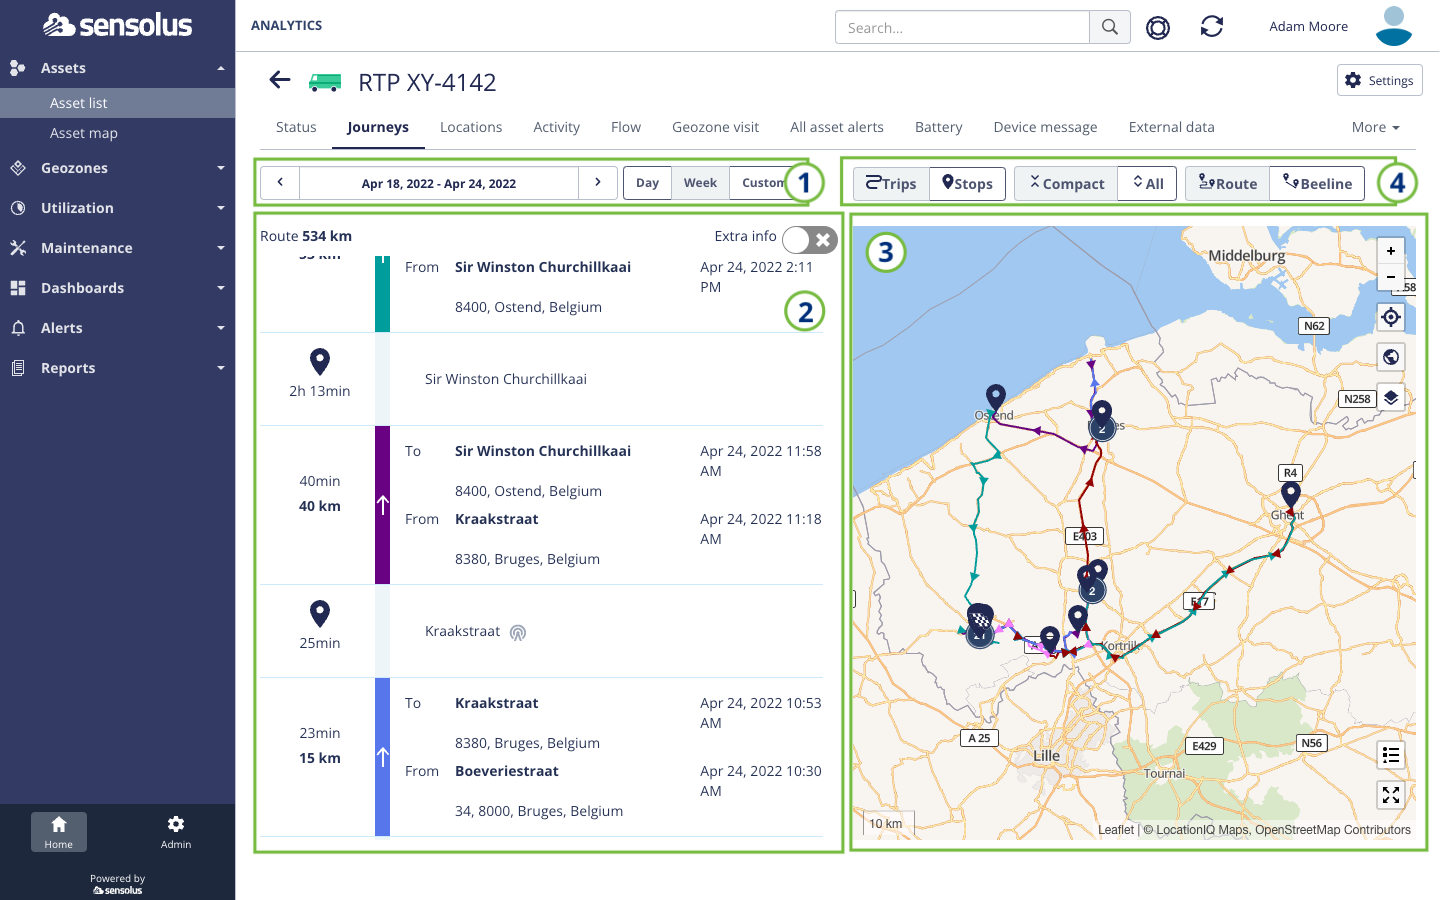
- Use the time filter to set the time range for which the journeys are shown. You can choose between day, week or a custom range.
- The list shows the sequence of stops and movements within the defined time interval.
- The map pane shows the trip, containing stops and intermediate locations.
- The journey map options contains a number of settings that influence how the list and map are rendered.
allow to toggle between trips and stop perspective and allow to define if you want to see the compact summary that eliminates short stops and movements or to see the full journey including all movements and stops
Switching between Trips and Stops view:
- Trips: The view will focus on the journey trips, adding information on stops in between. Each trip is shown with a separate color.
- Stops: The view will focus on the stops, adding information on the trips in between. Each stop is shown with a separate color.
Switching between Compact view and All view:
- Compact: Short stops or movements are merged, resulting in a more compact overview.
- All: All stop and movement events are shown as recorded, without processing of short events.
Switching between Route and Beeline:
- Route: The trips are shown on the map as the fastest route when driving on roads. Note that this just shows the fastest route according to the map service, not the actual route followed by the asset. The route option is not available when there is a very high number of data points (>200 points) to display, or when the asset is a powered tracker that emits very frequent locations.
- Beeline: The trips are shown as straight lines.
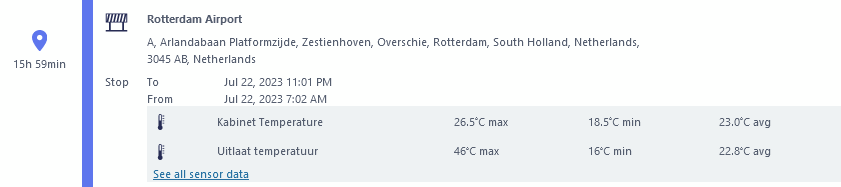
When you have sensor attached to your tracking device, the values of the sensors are also shown on the Journey timeline.
 Extra info button the
sensor data will appear under the location information.
Extra info button the
sensor data will appear under the location information.